Market Outlook
March 10, 2017
Market Cues
Domestic Indices
Chg (%)
(Pts)
(Close)
Indian markets are likely to open on positive note after the exit polls by various
BSE Sensex
0.1
27
28,929
agencies have given an indication towards BJP gaining a strong hold in the key state
Nifty
0.0
3
8,927
UP.
Mid Cap
(0.2)
(29)
13,400
The US markets remained subdued and traded in a narrow range for the day and
Small Cap
(0.1)
(12)
13,621
finally closed on a flat note. Further direction in the US market will be decide by the
monthly job data to be published later today. The European markets also remained
Bankex
0.2
57
23,628
in a narrow range ahead of ECB’s decision on interest rates.
Global Indices
Chg (%)
(Pts)
(Close)
Indian markets remained in narrow range for another day. It seems traders
remained cautious ahead of exit poll results to be declared at the end of the day. In
Dow Jones
0
3
20,858
the domestic markets index heavy weight RIL remained very active in trading.
Nasdaq
0
1
5,839
FTSE
(0.3)
(20)
7,315
News Analysis
Nikkei
0.3
65
19,319
6604 KM of NH constructed till February,2016
Hang Seng
(1.2)
(281)
23,502
Detailed analysis on Pg2
Shanghai Com
(0.7)
(24)
3,217
Investor’s Ready Reckoner
Key Domestic & Global Indicators
Advances / Declines
BSE
NSE
Stock Watch: Latest investment recommendations on 150+ stocks
Advances
1,189
664
Refer Pg5 onwards
Declines
1,647
967
Unchanged
156
Top Picks
91
CMP
Target
Upside
Company
Sector
Rating
(`)
(`)
(%)
Volumes (` Cr)
Amara Raja Batteries Auto & Auto Ancillary
Buy
824
1,009
22.4
BSE
54,293
HCL Tech
IT
Buy
845
1,000
18.3
Power Grid Corp.
Power
Accumulate
194
223
14.8
NSE
19,523
Navkar Corp.
Others
Buy
160
265
65.5
KEI Industries
Others
Buy
173
207
19.7
Net Inflows (` Cr)
Net
Mtd
Ytd
More Top Picks on Pg3
FII
488
6999
12,634
MFs
11
(3846)
5,881
Key Upcoming Events
Previous
Consensus
Date
Region
Event Description
Reading
Expectations
Top Gainers
Price (`)
Chg (%)
Mar 10 Euro Zone ECB announces interest rates
0.00
0.00
Balramchin
154
5.0
Mar 10 India
Industrial Production YoY
-0.40
0.40
Mar 10 India
Monthly Wholesale Prices YoY%
5.25
6.10
Dishtv
104
4.1
Mar 10 US
Change in Nonfarm payrolls
227.00
200.00
Eclerx
1,388
3.3
Mar 14 US
Unemployment rate
4.80
4.70
Hdil
71
3.1
Mar 14 US
Producer Price Index (mom)
1.10
Ofss
3,939
2.7
Mar 15 India
Imports YoY%
10.70
More Events on Pg4
Top Losers
Price (`)
Chg (%)
Drreddy
2,709
(5.0)
Gvkpil
6
(4.1)
Aban
218
(3.4)
Jindalstel
118
(3.3)
Sobha
306
(3.3)
As on March 09, 2017
Market Outlook
March 10, 2017
News Analysis
6604 KM of National Highway constructed till February, 2017
Minister of state for road transport and highways, P Radhakrishnan said in a
written reply to a question raised in the Lok Sabha today, that a total of 6604 km
of national highway has been constructed till February, 2017. “The slow speed of
construction of National Highways is mainly due to land acquisitions, utility
shifting, non availability of soil aggregates, poor performance of contractors,
environment/ forest/wildlife clearance etc “said the Minister. The Govt has
achieved only 44% of the targeted 15,000 KM of NH to be constructed for the full
year in the first 10 months of the financial year. Earlier the Govt had kept a
target of 30 Km/ day of construction per day while the current run rate is about
21km / day.
Economic and Political News
Parliament passes new maternity Benefits Act
Defense allocation should go up says; Parliamentary Panel
NBFC cash loans against gold restricted to `25,000cr.
Corporate News
RIL shares worth `50,000cr change hands in BSE
Delhi High Court bars CIPLA from selling copies of Novartis AGs respitory
drug Onbrez in India
GDF International plans to sell its entire 10% stake in Petronet LNG
Market Outlook
March 10, 2017
Top Picks
Large Cap
M
arket Cap
CM
P
T
arget
Upsid
e
Company
Rationale
(` Cr)
(`)
(`)
(%)
To outpace battery industry growth due to better technological
Amara Raja Batteries
14,082
824
1,009
22.4
products leading to market share gains in both the
automotive OEM and replacement segments.
Strong growth in domestic business due to its leadership in
Alkem Laboratories
23,649
1,978
2,257
14.1
acute therapeutic segment. Alkem expects to launch more
products in USA, which bodes for its international business.
The stock is trading at attractive valuations and is factoring all
HCL Tech
1,19,262
845
1,000
18.3
the bad news.
Back on the growth trend, expect a long term growth of 14%
Infosys
2,32,359
1,012
1,249
23.4
to be a US$20bn in FY2020.
Strong order backlog and improvement in execution would
Larsen & Toubro
1,37,794
1,477
1,634
10.6
trigger the growth for the L&T
One of the largest pharma companies with strong
Lupin
65,463
1,450
1,809
24.8
international presence. It has a rich pipeline of ANDAs which
is also one of the largest among the generic companies.
Going forward, we expect the company to report strong top-
Power Grid Corporation
1,01,624
194
223
14.8
line CAGR of ~16% and bottom-line CAGR of ~19% over
FY16-18 on back of strong capitalization guidance
Source: Company, AngelResearch
Mid Cap
M
arket Cap
CM
P
T
arget
Upsid
e
Company
Rationale
(` Cr)
(`)
(`)
(%)
We expect the company would report strong profitability
Asian Granito
842
280
351
25.5
owing to better product mix, higher B2C sales and
amalgamation synergy.
Among the top 4 players in the consumer durables segment.
Bajaj Electricals
2,857
282
295
4.5
Improved profitability backed by turn around in E&P segment.
Strong order book lends earnings visibility.
Favourable outlook for the AC industry to augur well for
Cooling products business which is out pacing the market
Blue Star
5,255
550
634
15.3
growth. EMPPAC division's profitability to improve once
operating environment turns around.
With a focus on the low and medium income (LMI) consumer
Dewan Housing Finance
10,208
326
350
7.4
segment, the company has increased its presence in tier-II &
III cities where the growth opportunity is immense.
Strong loan growth backed by diversified loan portfolio and
Equitas Holdings
5,546
164
235
43.0
adequate CAR. ROE & ROA likely to remain decent as risk of
dilution remains low. Attractive valuations considering growth.
Economic recovery to have favourable impact on advertising
& circulation revenue growth. Further, the acquisition of a
Jagran Prakashan
6,167
189
225
19.3
radio business (Radio City) would also boost the company's
revenue growth.
High order book execution in EPC segment, rising B2C sales
KEI Industries
1,346
173
207
19.7
and higher exports to boost the revenues and profitability
Speedier execution and speedier sales, strong revenue visibilty
Mahindra Lifespace
1,517
370
522
41.2
in short-to-long run, attractive valuations
Higher growth in domestic branded sales and healthy export
Mirza International
1,063
88
107
21.1
to boost the profitability.
Massive capacity expansion along with rail advantage at ICD
Navkar Corporation
2,283
160
265
65.5
as well CFS augurs well for the company
Market leadership in Hindi news genre and no. 2 viewership
ranking in English news genre, exit from the radio business,
TV Today Network
1,524
256
344
34.6
and anticipated growth in ad spends by corporates to benefit
the stock.
Source: Company, Angel Research
Market Outlook
March 10, 2017
Key Upcoming Events
Global economic events release calendar
Bloomberg Data
Date
Time
Country
Event Description
Unit
Period
Last Reported
Estimated
Mar 10, 2017
6:15 PM Euro Zone ECB announces interest rates
%
Mar 9
0.00
0.00
5:30 PM India
Industrial Production YoY
% Change
Jan
-0.40
0.40
12:00 PM India
Monthly Wholesale Prices YoY%
% Change
Feb
5.25
6.10
7:00 PM US
Change in Nonfarm payrolls
Thousands
Feb
227.00
200.00
Mar 14, 2017
7:00 PM US
Unemployment rate
%
Feb
4.80
4.70
US
Producer Price Index (mom)
% Change
Feb
1.10
Mar 15, 2017
India
Imports YoY%
% Change
Feb
10.70
India
Exports YoY%
% Change
Feb
4.30
3:00 PM UK
Jobless claims change
% Change
Feb
-42.40
6:00 PM US
Consumer price index (mom)
% Change
Feb
0.60
0.00
11:30 PM US
FOMC rate decision
%
Mar 15
0.75
1.00
Mar 16, 2017
3:30 PM Euro Zone Euro-Zone CPI (YoY)
%
Feb F
2.00
6:00 PM US
Housing Starts
Thousands
Feb
1246.00
1258.00
6:00 PM US
Building permits
Thousands
Feb
1293.00
1250.00
6:45 PM US
Industrial Production
%
Feb
-0.25
0.20
Mar 17, 2017
5:30 PM UK
BOE Announces rates
% Ratio
Mar 16
0.25
March 21, 2017 3:00 PM UK
CPI (YoY)
% Change
Feb
1.80
Mar 22, 2017
7:30 PM US
Existing home sales
Million
Feb
5.69
5.60
Mar 23, 2017
8:30 PM Euro Zone Euro-Zone Consumer Confidence
Value
Mar A
-6.20
7:30 PM US
New home sales
Thousands
Feb
555.00
565.00
Mar 24, 2017
2:00 PM Germany PMI Services
Value
Mar P
54.40
2:00 PM Germany PMI Manufacturing
Value
Mar P
56.80
Mar 28, 2017
7:30 PM US
Consumer Confidence
S.A./ 1985=100 Mar
114.80
Mar 30, 2017
6:00 PM US
GDP Qoq (Annualised)
% Change 4Q T
1.90
Mar 31, 2017
6:30 AM China
PMI Manufacturing
Value
Apr
51.60
51.20
Source: Bloomberg, Angel Research
Market Outlook
March 10, 2017
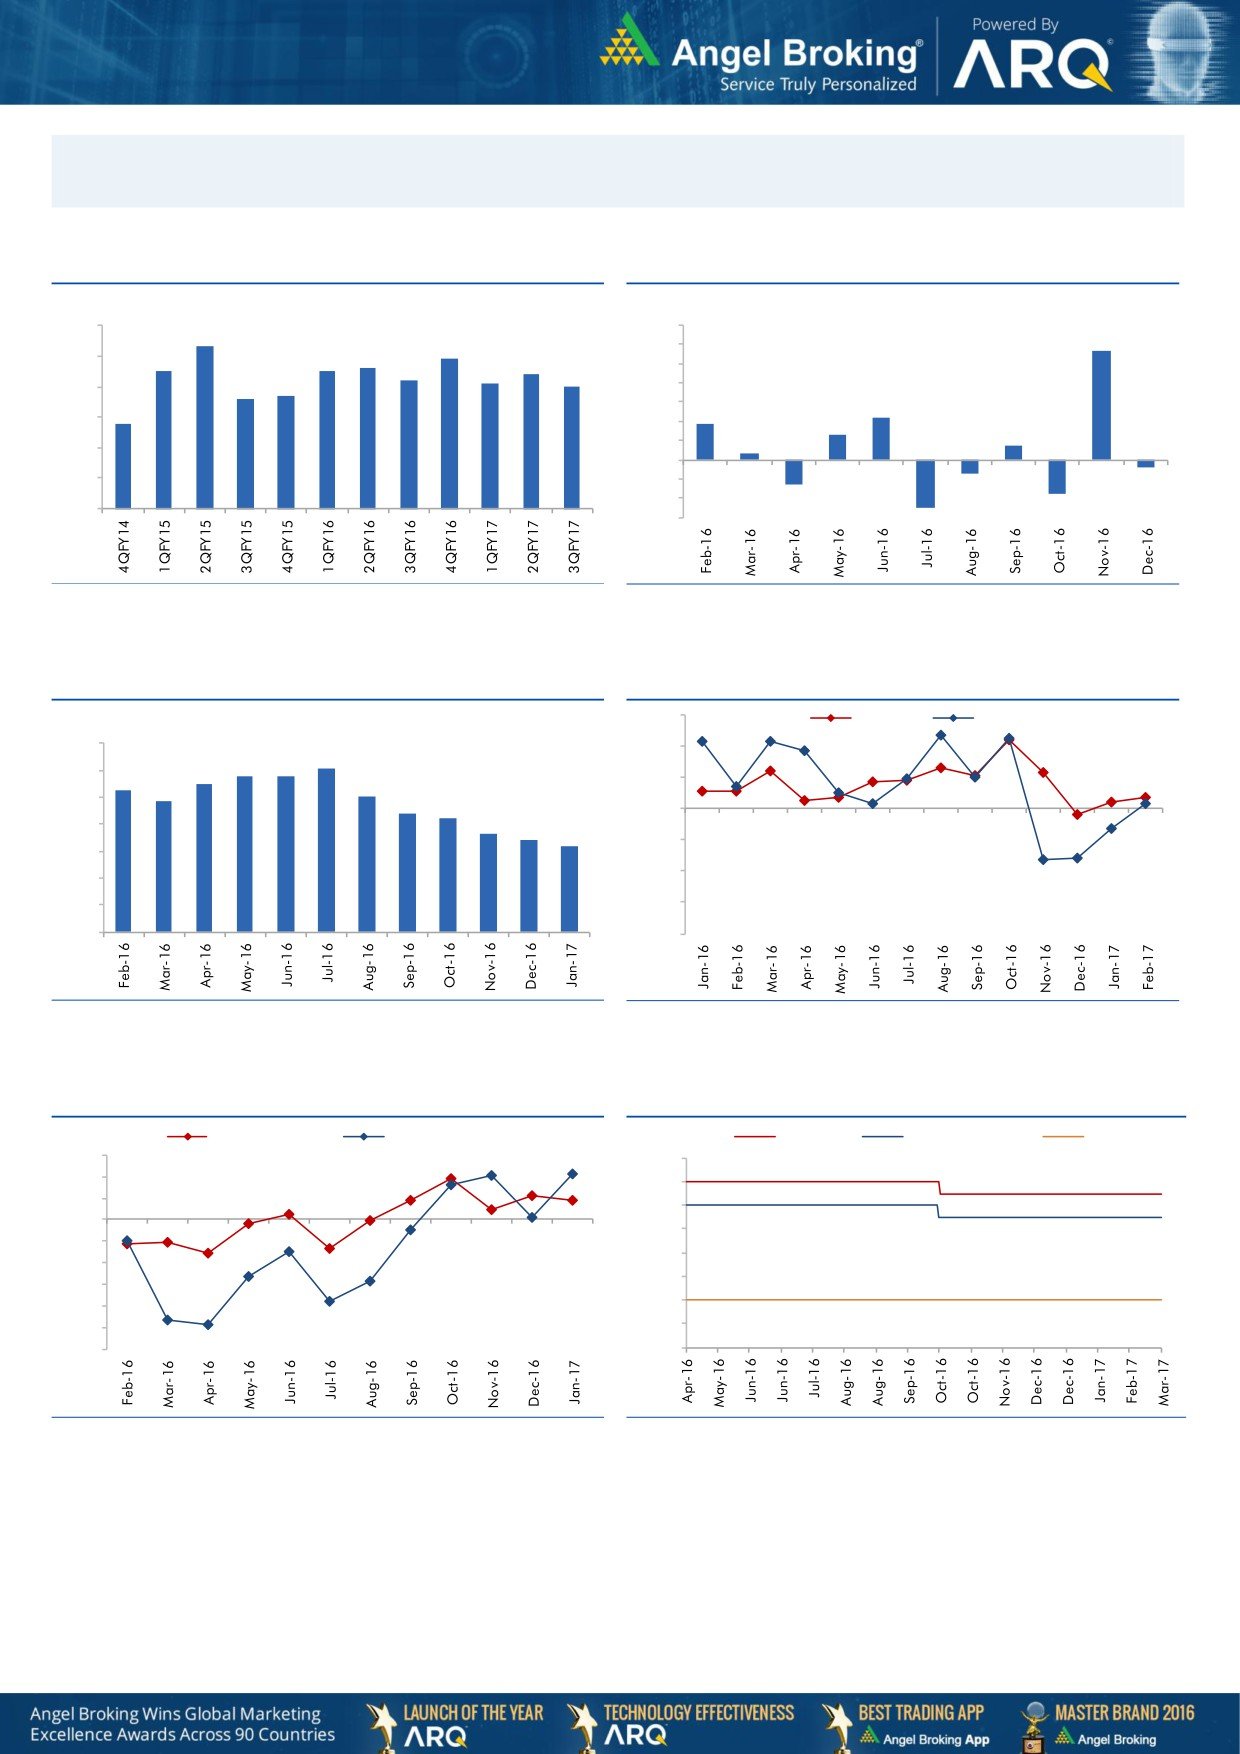
Macro watch
Exhibit 1: Quarterly GDP trends
Exhibit 2: IIP trends
(%)
(%)
9.0
8.3
7.0
5.7
7.9
6.0
8.0
7.5
7.5
7.6
7.4
7.2
5.0
7.1
7.0
6.6
6.7
4.0
7.0
3.0
2.2
5.8
1.9
6.0
2.0
1.3
0.7
1.0
0.3
5.0
-
4.0
(1.0)
(0.7)
(0.4)
(2.0)
3.0
(1.3)
(3.0)
(1.8)
(2.5)
Source: CSO, Angel Research
Source: MOSPI, Angel Research
Exhibit 3: Monthly CPI inflation trends
Exhibit 4: Manufacturing and services PMI
56.0
Mfg. PMI
Services PMI
(%)
7.0
54.0
6.1
5.8
5.8
6.0
5.3
5.5
5.1
52.0
4.8
5.0
4.4
4.2
50.0
3.6
4.0
3.4
3.2
48.0
3.0
46.0
2.0
1.0
44.0
-
42.0
Source: MOSPI, Angel Research
Source: Market, Angel Research; Note: Level above 50 indicates expansion
Exhibit 5: Exports and imports growth trends
Exhibit 6: Key policy rates
(%)
Exports yoy growth
Imports yoy growth
(%)
Repo rate
Reverse Repo rate
CRR
15.0
7.00
10.0
6.50
5.0
6.00
0.0
5.50
(5.0)
5.00
(10.0)
4.50
(15.0)
4.00
(20.0)
(25.0)
3.50
(30.0)
3.00
Source: Bloomberg, Angel Research
Source: RBI, Angel Research
Stock Watch
March 10, 2017
Company Name
Reco
CMP
Target
Mkt Cap
Sales ( Čcr )
OPM(%)
EPS (Č)
PER(x)
P/BV(x)
RoE(%)
EV/Sales(x)
(Č)
Price ( Č)
( Č cr )
FY17E FY18E
FY17E
FY18E
FY17E
FY18E
FY17E
FY18E
FY17E
FY18E
FY17E
FY18E
FY17E
FY18E
Agri / Agri Chemical
Rallis
Neutral
237
-
4,617
1,937
2,164
13.3
14.3
9.0
11.0
26.4
21.6
4.6
4.0
18.4
19.8
2.4
2.1
United Phosphorus
Neutral
712
-
36,123
15,176
17,604
18.5
18.5
37.4
44.6
19.0
16.0
3.7
3.1
21.4
21.2
2.5
2.1
Auto & Auto Ancillary
Ashok Leyland
Buy
90
111
25,713
20,021
21,915
11.6
11.9
4.5
5.3
20.1
17.0
4.1
3.6
20.6
21.5
1.2
1.1
Bajaj Auto
Neutral
2,873
-
83,126
25,093
27,891
19.5
19.2
143.9
162.5
20.0
17.7
5.6
4.8
30.3
29.4
3.0
2.7
Bharat Forge
Neutral
1,032
-
24,022
7,726
8,713
20.5
21.2
35.3
42.7
29.2
24.2
5.4
4.9
18.9
20.1
3.2
2.8
Eicher Motors
Neutral
23,397
-
63,664
16,583
20,447
17.5
18.0
598.0
745.2
39.1
31.4
13.4
10.2
41.2
38.3
3.7
2.9
Gabriel India
Accumulate
115
130
1,645
1,544
1,715
9.0
9.3
5.4
6.3
21.2
18.2
4.0
3.6
18.9
19.5
1.0
0.9
Hero Motocorp
Accumulate
3,274
3,446
65,375
28,083
30,096
15.3
15.7
171.8
187.0
19.1
17.5
6.7
5.6
30.1
27.9
2.2
2.0
Jamna Auto Industries Neutral
206
-
1,644
1,486
1,620
9.8
9.9
15.0
17.2
13.8
12.0
3.0
2.6
21.8
21.3
1.2
1.1
L G Balakrishnan & Bros Neutral
573
-
899
1,302
1,432
11.6
11.9
43.7
53.0
13.1
10.8
1.9
1.7
13.8
14.2
0.8
0.7
Mahindra and Mahindra Neutral
1,304
-
80,984
46,534
53,077
11.6
11.7
67.3
78.1
19.4
16.7
3.2
2.8
15.4
15.8
1.7
1.5
Maruti
Accumulate
5,962
6,560
180,097
67,822
83,288
16.0
16.4
253.8
312.4
23.5
19.1
5.4
4.4
23.0
22.9
2.3
1.8
Minda Industries
Neutral
436
-
3,455
2,728
3,042
9.0
9.1
68.2
86.2
6.4
5.1
1.5
1.2
23.8
24.3
1.3
1.2
Motherson Sumi
Neutral
357
-
50,045
45,896
53,687
7.8
8.3
13.0
16.1
27.3
22.2
8.8
7.0
34.7
35.4
1.2
1.0
Rane Brake Lining
Neutral
929
-
736
511
562
11.3
11.5
28.1
30.9
33.1
30.1
5.1
4.6
15.3
15.0
1.6
1.5
Setco Automotive
Neutral
35
-
465
741
837
13.0
13.0
15.2
17.0
2.3
2.0
0.4
0.3
15.8
16.3
1.0
0.9
Tata Motors
Neutral
468
-
135,012
300,209
338,549
8.9
8.4
42.7
54.3
11.0
8.6
1.8
1.5
15.6
17.2
0.6
0.5
TVS Motor
Neutral
420
-
19,949
13,390
15,948
6.9
7.1
12.8
16.5
32.9
25.4
8.2
6.5
26.3
27.2
1.5
1.3
Amara Raja Batteries
Buy
824
1,009
14,082
5,305
6,100
16.0
16.3
28.4
34.0
29.0
24.3
5.6
4.7
19.3
19.3
2.7
2.3
Exide Industries
Neutral
212
-
18,012
7,439
8,307
15.0
15.0
8.1
9.3
26.2
22.8
3.7
3.3
14.3
16.7
2.0
1.8
Apollo Tyres
Buy
180
235
9,160
12,877
14,504
14.3
13.9
21.4
23.0
8.4
7.8
1.3
1.1
16.4
15.2
0.9
0.8
Ceat
Buy
1,164
1,450
4,706
7,524
8,624
13.0
12.7
131.1
144.3
8.9
8.1
1.6
1.4
19.8
18.6
0.7
0.6
JK Tyres
Neutral
118
-
2,667
7,455
8,056
15.0
15.0
21.8
24.5
5.4
4.8
1.1
0.9
22.8
21.3
0.5
0.4
Swaraj Engines
Neutral
1,368
-
1,700
660
810
15.2
16.4
54.5
72.8
25.1
18.8
7.8
7.1
31.5
39.2
2.4
1.9
Subros
Neutral
198
-
1,187
1,488
1,681
11.7
11.9
6.4
7.2
30.9
27.6
3.3
3.0
10.8
11.4
1.0
0.9
Indag Rubber
Neutral
184
-
482
286
326
19.8
16.8
11.7
13.3
15.7
13.8
2.7
2.5
17.8
17.1
1.4
1.2
Capital Goods
ACE
Neutral
53
-
527
709
814
4.1
4.6
1.4
2.1
38.1
25.4
1.6
1.5
4.4
6.0
0.9
0.8
BEML
Neutral
1,283
-
5,344
3,451
4,055
6.3
9.2
31.4
57.9
40.9
22.2
2.5
2.2
6.3
10.9
1.7
1.4
Bharat Electronics
Neutral
1,554
-
34,721
8,137
9,169
16.8
17.2
58.7
62.5
26.5
24.9
4.1
3.7
44.6
46.3
3.2
2.9
Stock Watch
March 10, 2017
Company Name
Reco
CMP
Target
Mkt Cap
Sales ( Čcr )
OPM(%)
EPS (Č)
PER(x)
P/BV(x)
RoE(%)
EV/Sales(x)
(Č)
Price ( Č)
( Č cr )
FY17E
FY18E
FY17E
FY18E
FY17E
FY18E
FY17E
FY18E
FY17E
FY18E
FY17E
FY18E
FY17E
FY18E
Capital Goods
Voltas
Accumulate
385
407
12,747
6,511
7,514
7.9
8.7
12.9
16.3
29.9
23.6
5.4
4.7
16.7
18.5
1.7
1.5
BGR Energy
Neutral
131
-
948
16,567
33,848
6.0
5.6
7.8
5.9
16.8
22.3
1.0
0.9
4.7
4.2
0.2
0.1
BHEL
Neutral
158
-
38,586
28,797
34,742
-
2.8
2.3
6.9
68.5
22.9
1.2
1.1
1.3
4.8
1.0
0.7
Blue Star
Buy
550
634
5,255
4,283
5,077
5.9
7.3
14.9
22.1
36.9
24.9
7.2
6.0
20.4
26.4
1.3
1.1
Crompton Greaves
#VALUE!
5,777
6,120
5.9
7.0
3.3
4.5
4.4
5.9
Greaves Cotton
Neutral
160
-
3,915
1,755
1,881
16.8
16.9
7.8
8.5
20.6
18.9
4.1
3.8
20.6
20.9
1.9
1.8
Inox Wind
Neutral
179
-
3,970
5,605
6,267
15.7
16.4
24.8
30.0
7.2
6.0
2.0
1.5
25.9
24.4
0.7
0.6
KEC International
Neutral
162
-
4,170
9,294
10,186
7.9
8.1
9.9
11.9
16.4
13.6
2.4
2.1
15.6
16.3
0.7
0.6
KEI Industries
Buy
173
207
1,346
2,682
3,058
10.4
10.0
11.7
12.8
14.7
13.5
3.0
2.5
20.1
18.2
0.7
0.6
Thermax
Neutral
861
-
10,261
5,421
5,940
7.3
7.3
25.7
30.2
33.5
28.5
4.1
3.7
12.2
13.1
1.8
1.6
VATech Wabag
Buy
559
681
3,049
3,136
3,845
8.9
9.1
26.0
35.9
21.5
15.6
2.7
2.3
13.4
15.9
0.9
0.7
Cement
ACC
Neutral
1,402
-
26,330
11,225
13,172
13.2
16.9
44.5
75.5
31.5
18.6
3.0
2.8
11.2
14.2
2.4
2.0
Ambuja Cements
Neutral
227
-
45,025
9,350
10,979
18.2
22.5
5.8
9.5
39.1
23.9
3.3
2.9
10.2
12.5
4.8
4.1
India Cements
Neutral
160
-
4,900
4,364
4,997
18.5
19.2
7.9
11.3
20.2
14.1
1.5
1.4
8.0
8.5
1.9
1.6
JK Cement
Neutral
859
-
6,005
4,398
5,173
15.5
17.5
31.2
55.5
27.5
15.5
3.3
2.9
12.0
15.5
1.9
1.6
J K Lakshmi Cement
Neutral
410
-
4,821
2,913
3,412
14.5
19.5
7.5
22.5
54.6
18.2
3.4
2.8
12.5
18.0
2.2
1.9
Orient Cement
Neutral
135
-
2,761
2,114
2,558
18.5
20.5
8.1
11.3
16.6
11.9
2.5
2.1
9.0
14.0
1.9
1.5
UltraTech Cement
Neutral
3,822
-
104,902
25,768
30,385
21.0
23.5
111.0
160.0
34.4
23.9
4.4
3.8
13.5
15.8
4.2
3.5
Construction
ITNL
Neutral
101
-
3,334
8,946
10,017
31.0
31.6
8.1
9.1
12.5
11.1
0.5
0.5
4.2
5.0
3.7
3.4
KNR Constructions
Neutral
181
-
2,545
1,385
1,673
14.7
14.0
41.2
48.5
4.4
3.7
0.8
0.7
14.9
15.2
1.9
1.6
Larsen & Toubro
Accumulate
1,477
1,634
137,794
111,017
124,908
11.0
11.0
61.1
66.7
24.2
22.1
2.9
2.7
13.1
12.9
2.3
2.1
Gujarat Pipavav Port
Neutral
155
-
7,488
705
788
52.2
51.7
5.0
5.6
31.0
27.7
3.1
2.7
11.2
11.2
10.3
8.7
Nagarjuna Const.
Neutral
79
-
4,406
8,842
9,775
9.1
8.8
5.3
6.4
15.0
12.4
1.2
1.1
8.2
9.1
0.7
0.6
PNC Infratech
Buy
100
143
2,577
2,350
2,904
13.1
13.2
9.0
8.8
11.2
11.4
0.4
0.4
15.9
13.9
1.2
1.0
Simplex Infra
Neutral
286
-
1,414
6,829
7,954
10.5
10.5
31.4
37.4
9.1
7.6
0.9
0.9
9.9
13.4
0.6
0.5
Power Mech Projects
Neutral
404
-
594
1,801
2,219
12.7
14.6
72.1
113.9
5.6
3.6
1.0
0.9
16.8
11.9
0.3
0.2
Sadbhav Engineering
Accumulate
278
298
4,772
3,598
4,140
10.3
10.6
9.0
11.9
30.9
23.4
3.2
2.8
9.9
11.9
1.6
1.4
NBCC
Neutral
169
-
15,183
7,428
9,549
7.9
8.6
8.2
11.0
20.6
15.3
1.0
0.8
28.2
28.7
1.8
1.3
MEP Infra
Neutral
46
-
754
1,877
1,943
30.6
29.8
3.0
4.2
15.5
11.1
7.5
5.0
0.6
0.6
1.8
1.6
Stock Watch
March 10, 2017
Company Name
Reco
CMP
Target
Mkt Cap
Sales ( Čcr )
OPM(%)
EPS (Č)
PER(x)
P/BV(x)
RoE(%)
EV/Sales(x)
(Č)
Price ( Č)
( Č cr )
FY17E
FY18E
FY17E
FY18E
FY17E
FY18E
FY17E
FY18E
FY17E
FY18E
FY17E
FY18E
FY17E
FY18E
Construction
SIPL
Neutral
96
-
3,367
1,036
1,252
65.5
66.2
(8.4)
(5.6)
3.6
4.1
(22.8)
(15.9)
11.5
9.5
Engineers India
Neutral
145
-
9,795
1,725
1,935
16.0
19.1
11.4
13.9
12.8
10.5
1.8
1.7
13.4
15.3
4.6
4.1
Financials
Axis Bank
Accumulate
516
580
123,500
46,932
53,575
3.5
3.4
32.4
44.6
16.0
11.6
2.1
1.8
13.6
16.5
-
-
Bank of Baroda
Neutral
159
-
36,705
19,980
23,178
1.8
1.8
11.5
17.3
13.9
9.2
1.6
1.3
8.3
10.1
-
-
Canara Bank
Neutral
286
-
15,546
15,225
16,836
1.8
1.8
14.5
28.0
19.7
10.2
1.4
1.1
5.8
8.5
-
-
Can Fin Homes
Accumulate
1,942
2,128
5,170
420
526
3.5
3.5
86.5
107.8
22.5
18.0
4.8
4.0
23.6
24.1
-
-
Cholamandalam Inv. &
Buy
937
1,230
14,636
2,012
2,317
6.3
6.3
42.7
53.6
21.9
17.5
3.5
3.0
16.9
18.3
-
-
Fin. Co.
Dewan Housing Finance Accumulate
326
350
10,208
2,225
2,688
2.9
2.9
29.7
34.6
11.0
9.4
1.8
1.5
16.1
16.8
-
-
Equitas Holdings
Buy
164
235
5,546
939
1,281
11.7
11.5
5.8
8.2
28.3
20.0
2.4
2.2
10.9
11.5
-
-
Federal Bank
Neutral
86
-
14,740
8,259
8,995
3.0
3.0
4.3
5.6
19.9
15.3
1.7
1.6
8.5
10.1
-
-
HDFC
Neutral
1,371
-
217,471
11,475
13,450
3.4
3.4
45.3
52.5
30.3
26.1
5.8
5.2
20.2
20.5
-
-
HDFC Bank
Neutral
1,395
-
357,131
46,097
55,433
4.5
4.5
58.4
68.0
23.9
20.5
4.2
3.5
18.8
18.6
-
-
ICICI Bank
Buy
273
315
159,111
42,800
44,686
3.1
3.3
18.0
21.9
15.2
12.5
2.1
1.9
11.1
12.3
-
-
Lakshmi Vilas Bank
Accumulate
164
174
3,134
3,339
3,799
2.7
2.8
11.0
14.0
14.9
11.7
1.5
1.4
11.2
12.7
-
-
LIC Housing Finance
Accumulate
568
630
28,672
3,712
4,293
2.6
2.5
39.0
46.0
14.6
12.4
2.7
2.3
19.9
20.1
-
-
Punjab Natl.Bank
Neutral
141
-
30,079
23,532
23,595
2.3
2.4
6.8
12.6
20.8
11.2
3.2
2.3
3.3
6.5
-
-
RBL Bank
Neutral
472
-
17,448
1,783
2,309
2.6
2.6
12.7
16.4
37.2
28.8
4.1
3.6
12.8
13.3
-
-
Repco Home Finance
Buy
626
825
3,915
388
457
4.5
4.2
30.0
38.0
20.9
16.5
3.5
2.9
18.0
19.2
-
-
South Ind.Bank
Neutral
20
-
2,745
6,435
7,578
2.5
2.5
2.7
3.1
7.5
6.6
1.0
0.8
10.1
11.2
-
-
St Bk of India
Neutral
273
-
217,836
88,650
98,335
2.6
2.6
13.5
18.8
20.2
14.5
1.9
1.7
7.0
8.5
-
-
Union Bank
Neutral
146
-
10,040
13,450
14,925
2.3
2.3
25.5
34.5
5.7
4.2
0.8
0.7
7.5
10.2
-
-
Yes Bank
Neutral
1,465
-
62,079
8,978
11,281
3.3
3.4
74.0
90.0
19.8
16.3
3.8
3.2
17.0
17.2
-
-
FMCG
Akzo Nobel India
Accumulate
1,591
1,720
7,628
2,955
3,309
13.3
13.7
57.2
69.3
27.8
23.0
9.1
7.6
32.7
33.3
2.4
2.1
Asian Paints
Neutral
1,031
-
98,903
17,128
18,978
16.8
16.4
19.1
20.7
54.0
49.8
18.8
17.7
34.8
35.5
5.7
5.1
Britannia
Buy
3,072
3,626
36,862
9,594
11,011
14.6
14.9
80.3
94.0
38.3
32.7
15.7
12.2
41.2
-
3.7
3.2
Colgate
Accumulate
945
995
25,696
4,605
5,149
23.4
23.4
23.8
26.9
39.7
35.1
22.0
17.2
64.8
66.8
5.5
4.9
Dabur India
Accumulate
275
304
48,380
8,315
9,405
19.8
20.7
8.1
9.2
33.9
29.9
9.4
7.8
31.6
31.0
5.5
4.8
GlaxoSmith Con*
Neutral
5,266
-
22,145
4,350
4,823
21.2
21.4
179.2
196.5
29.4
26.8
7.8
6.6
27.1
26.8
4.5
4.0
Godrej Consumer
Neutral
1,619
-
55,145
10,235
11,428
18.4
18.6
41.1
44.2
39.4
36.6
8.7
7.4
24.9
24.8
5.5
4.8
Stock Watch
March 10, 2017
Company Name
Reco
CMP
Target
Mkt Cap
Sales ( Čcr )
OPM(%)
EPS (Č)
PER(x)
P/BV(x)
RoE(%)
EV/Sales(x)
(Č)
Price ( Č)
( Č cr )
FY17E FY18E
FY17E
FY18E
FY17E
FY18E
FY17E
FY18E
FY17E
FY18E
FY17E
FY18E
FY17E
FY18E
FMCG
HUL
Neutral
870
-
188,349
35,252
38,495
17.8
17.8
20.7
22.4
42.2
38.9
40.3
34.6
95.6
88.9
5.2
4.7
ITC
Accumulate
265
284
321,408
40,059
44,439
38.3
39.2
9.0
10.1
29.5
26.1
8.2
7.2
27.8
27.5
7.5
6.8
Marico
Accumulate
280
300
36,111
6,430
7,349
18.8
19.5
6.4
7.7
43.7
36.3
13.2
11.1
33.2
32.5
5.4
4.7
Nestle*
Neutral
6,209
-
59,865
10,073
11,807
20.7
21.5
124.8
154.2
49.8
40.3
20.4
18.4
34.8
36.7
5.8
4.9
Tata Global
Neutral
141
-
8,886
8,675
9,088
9.8
9.8
7.4
8.2
19.0
17.2
1.5
1.4
7.9
8.1
0.9
0.9
Procter & Gamble
Accumulate
6,836
7,369
22,190
2,939
3,342
23.2
23.0
146.2
163.7
46.8
41.8
11.8
9.8
25.3
23.5
7.1
6.2
Hygiene
IT
HCL Tech^
Buy
845
1,000
119,262
49,242
57,168
20.5
20.5
55.7
64.1
15.2
13.2
3.1
2.4
20.3
17.9
2.3
1.9
Infosys
Buy
1,012
1,249
232,359
68,350
77,326
27.0
27.0
62.5
69.4
16.2
14.6
3.5
3.2
21.3
21.6
2.8
2.5
TCS
Accumulate
2,520
2,700
496,459
119,025
133,308
27.6
27.6
131.2
145.5
19.2
17.3
6.2
5.7
32.4
33.1
3.9
3.5
Tech Mahindra
Buy
489
600
47,606
29,673
32,937
15.5
17.0
32.8
39.9
14.9
12.3
2.9
2.5
19.6
20.7
1.3
1.2
Wipro
Buy
484
583
117,703
55,440
60,430
18.1
18.1
36.1
38.9
13.4
12.5
2.4
2.2
19.0
17.6
1.8
1.6
Media
D B Corp
Neutral
379
-
6,976
2,297
2,590
27.4
28.2
21.0
23.4
18.1
16.2
4.2
3.7
23.7
23.1
2.8
2.4
HT Media
Neutral
83
-
1,942
2,693
2,991
12.6
12.9
7.9
9.0
10.6
9.3
0.9
0.8
7.8
8.3
0.3
0.2
Jagran Prakashan
Buy
189
225
6,167
2,355
2,635
28.0
28.0
10.8
12.5
17.5
15.1
3.8
3.3
21.7
21.7
2.6
2.3
Sun TV Network
Neutral
742
-
29,239
2,850
3,265
70.1
71.0
26.2
30.4
28.3
24.4
7.3
6.4
24.3
25.6
9.9
8.5
Hindustan Media
Neutral
270
-
1,985
1,016
1,138
24.3
25.2
27.3
30.1
9.9
9.0
1.9
1.7
16.2
15.8
1.3
1.1
Ventures
TV Today Network
Buy
256
344
1,524
567
645
26.7
27.0
15.4
18.1
16.6
14.1
2.5
2.2
14.9
15.2
2.3
1.9
Metals & Mining
Coal India
Neutral
318
-
197,520
84,638
94,297
21.4
22.3
24.5
27.1
13.0
11.7
5.4
5.2
42.6
46.0
1.8
1.7
Hind. Zinc
Neutral
292
-
123,358
14,252
18,465
55.9
48.3
15.8
21.5
18.5
13.6
3.0
2.6
17.0
20.7
8.7
6.7
Hindalco
Neutral
189
-
39,034
107,899
112,095
7.4
8.2
9.2
13.0
20.5
14.5
1.0
0.9
4.8
6.6
0.9
0.8
JSW Steel
Neutral
177
-
42,724
53,201
58,779
16.1
16.2
130.6
153.7
1.4
1.2
0.2
0.2
14.0
14.4
1.6
1.4
NMDC
Neutral
141
-
44,595
6,643
7,284
44.4
47.7
7.1
7.7
19.9
18.3
1.7
1.7
8.8
9.2
4.5
4.0
SAIL
Neutral
59
-
24,491
47,528
53,738
(0.7)
2.1
(1.9)
2.6
22.8
0.7
0.6
(1.6)
3.9
1.4
1.2
Vedanta
Neutral
253
-
74,888
71,744
81,944
19.2
21.7
13.4
20.1
18.9
12.6
1.6
1.5
8.4
11.3
1.4
1.1
Tata Steel
Neutral
470
-
45,599
121,374
121,856
7.2
8.4
18.6
34.3
25.2
13.7
1.6
1.4
6.1
10.1
1.0
1.0
Oil & Gas
Cairn India
Neutral
283
-
53,078
9,127
10,632
4.3
20.6
8.8
11.7
32.2
24.2
1.0
1.0
3.3
4.2
7.3
6.1
GAIL
Neutral
379
-
64,168
56,220
65,198
9.3
10.1
27.1
33.3
14.0
11.4
1.3
1.2
9.3
10.7
1.3
1.1
ONGC
Neutral
190
-
243,511
137,222
152,563
15.0
21.8
19.5
24.1
9.7
7.9
0.8
0.8
8.5
10.1
2.1
1.8
Indian Oil Corp
Neutral
375
-
181,975
373,359
428,656
5.9
5.5
54.0
59.3
6.9
6.3
1.1
1.0
16.0
15.6
0.6
0.6
Stock Watch
March 10, 2017
Company Name
Reco
CMP
Target
Mkt Cap
Sales ( Čcr )
OPM(%)
EPS (Č)
PER(x)
P/BV(x)
RoE(%)
EV/Sales(x)
(Č)
Price ( Č)
( Č cr )
FY17E FY18E
FY17E
FY18E
FY17E
FY18E
FY17E
FY18E
FY17E
FY18E
FY17E
FY18E
FY17E
FY18E
Oil & Gas
Reliance Industries
Neutral
1,287
-
417,614
301,963
358,039
12.1
12.6
87.7
101.7
14.7
12.7
1.5
1.4
10.7
11.3
1.9
1.5
Pharmaceuticals
Alembic Pharma
Accumulate
603
689
11,359
3,483
4,244
20.2
21.4
24.3
33.6
24.8
17.9
5.7
4.5
25.5
25.3
3.2
2.5
Alkem Laboratories Ltd
Accumulate
1,978
2,257
23,649
6,065
7,009
18.7
20.0
80.2
92.0
24.7
21.5
5.5
4.6
22.5
21.6
3.9
3.3
Aurobindo Pharma
Buy
658
877
38,519
15,720
18,078
23.7
23.7
41.4
47.3
15.9
13.9
4.1
3.2
29.6
26.1
2.7
2.3
Aventis*
Neutral
4,301
-
9,906
2,277
2,597
17.3
18.3
149.4
172.0
28.8
25.0
4.8
3.8
25.1
28.8
4.0
3.3
Cadila Healthcare
Neutral
439
-
44,978
10,429
12,318
17.7
21.6
13.1
19.2
33.5
22.9
7.0
5.6
22.8
27.1
4.4
3.6
Cipla
Sell
590
465
47,432
15,378
18,089
15.7
16.8
19.3
24.5
30.6
24.1
3.6
3.2
12.3
13.9
3.3
2.7
Dr Reddy's
Neutral
2,709
-
44,872
16,043
18,119
18.0
23.0
78.6
130.9
34.5
20.7
3.4
3.0
10.1
15.2
2.6
2.5
Dishman Pharma
Neutral
235
-
3,799
1,718
1,890
22.7
22.8
9.5
11.3
24.8
20.8
2.4
2.2
10.1
10.9
2.7
2.3
GSK Pharma*
Neutral
2,693
-
22,813
2,800
3,290
10.2
20.6
32.2
60.3
83.6
44.7
15.5
15.3
17.2
34.5
7.9
6.8
Indoco Remedies
Reduce
260
240
2,396
1,112
1,289
16.2
18.2
11.6
16.0
22.4
16.3
3.6
3.0
17.0
20.1
2.3
1.9
Ipca labs
Accumulate
549
613
6,930
3,258
3,747
12.8
15.3
12.1
19.2
45.4
28.6
2.8
2.6
6.4
9.5
2.3
2.0
Lupin
Buy
1,450
1,809
65,463
15,912
18,644
26.4
26.7
58.1
69.3
25.0
20.9
4.9
4.0
21.4
20.9
4.2
3.4
Sun Pharma
Buy
685
847
164,443
31,129
35,258
32.0
32.9
30.2
35.3
22.7
19.4
3.7
3.1
20.0
20.1
4.9
4.1
Power
Tata Power
Neutral
82
-
22,233
36,916
39,557
17.4
27.1
5.1
6.3
16.1
13.1
1.4
1.3
9.0
10.3
1.6
1.5
NTPC
Neutral
158
-
130,484
86,605
95,545
17.5
20.8
11.8
13.4
13.4
11.8
1.4
1.3
10.5
11.1
2.8
2.8
Power Grid
Accumulate
194
223
101,624
25,315
29,193
88.2
88.7
14.2
17.2
13.7
11.3
2.1
1.8
15.2
16.1
8.7
7.8
Real Estate
Prestige Estate
Buy
167
210
6,274
4,707
5,105
25.2
26.0
10.3
13.0
16.2
12.9
1.3
1.2
10.3
10.2
2.5
2.2
MLIFE
Buy
370
522
1,517
1,152
1,300
22.7
24.6
29.9
35.8
12.4
10.3
0.9
0.9
7.6
8.6
2.0
1.7
Telecom
Bharti Airtel
Neutral
360
-
144,066
105,086
114,808
34.5
34.7
12.2
16.4
29.5
22.0
2.0
1.9
6.8
8.4
2.3
2.0
Idea Cellular
Neutral
104
-
37,440
40,133
43,731
37.2
37.1
6.4
6.5
16.2
16.0
1.4
1.3
8.2
7.6
2.0
1.7
zOthers
Abbott India
Neutral
4,450
-
9,456
3,153
3,583
14.1
14.4
152.2
182.7
29.2
24.4
143.6
122.6
25.6
26.1
2.7
2.3
Asian Granito
Buy
280
351
842
1,060
1,169
12.2
12.5
12.7
15.9
22.1
17.6
2.1
1.9
9.5
10.7
1.1
1.0
Bajaj Electricals
Neutral
282
-
2,857
4,801
5,351
5.7
6.2
10.4
13.7
27.1
20.6
3.4
3.0
12.4
14.5
0.6
0.5
Banco Products (India)
Neutral
198
-
1,415
1,353
1,471
12.3
12.4
14.5
16.3
13.6
12.1
18.8
17.0
14.5
14.6
1.0
105.6
Coffee Day Enterprises
Neutral
233
-
4,791
2,964
3,260
20.5
21.2
4.7
8.0
-
29.1
2.7
2.5
5.5
8.5
2.0
1.8
Ltd
Competent Automobiles Neutral
170
-
105
1,137
1,256
3.1
2.7
28.0
23.6
6.1
7.2
32.7
29.6
14.3
11.5
0.1
0.1
Elecon Engineering
Neutral
52
-
588
1,482
1,660
13.7
14.5
3.9
5.8
13.4
9.0
3.2
2.9
7.8
10.9
0.7
0.6
Finolex Cables
Neutral
443
-
6,774
2,883
3,115
12.0
12.1
14.2
18.6
31.2
23.8
16.6
14.5
15.8
14.6
2.0
1.8
Stock Watch
March 10, 2017
Company Name
Reco
CMP
Target
Mkt Cap
Sales ( Čcr )
OPM(%)
EPS (Č)
PER(x)
P/BV(x)
RoE(%)
EV/Sales(x)
(Č)
Price ( Č)
( Č cr )
FY17E
FY18E
FY17E
FY18E
FY17E
FY18E
FY17E
FY18E
FY17E
FY18E
FY17E
FY18E
FY17E
FY18E
zOthers
Garware Wall Ropes
Neutral
698
-
1,527
863
928
15.1
15.2
36.4
39.4
19.2
17.7
3.5
3.0
17.5
15.9
1.7
1.5
Goodyear India*
Neutral
706
-
1,630
1,598
1,704
10.4
10.2
49.4
52.6
14.3
13.4
66.0
57.9
18.2
17.0
0.7
97.7
Hitachi
Neutral
1,500
-
4,079
2,081
2,433
8.8
8.9
33.4
39.9
44.9
37.6
36.2
30.2
22.1
21.4
2.0
1.6
HSIL
Neutral
324
-
2,345
2,384
2,515
15.8
16.3
15.3
19.4
21.2
16.7
21.1
18.1
7.8
9.3
1.2
1.1
Interglobe Aviation
Neutral
875
-
31,634
21,122
26,005
14.5
27.6
110.7
132.1
7.9
6.6
47.3
33.8
168.5
201.1
1.5
1.2
Jyothy Laboratories
Neutral
374
-
6,800
1,440
2,052
11.5
13.0
8.5
10.0
44.0
37.4
10.7
9.9
18.6
19.3
5.0
3.5
Kirloskar Engines India
Neutral
381
-
5,508
2,554
2,800
9.9
10.0
10.5
12.1
36.3
31.5
15.2
14.3
10.7
11.7
1.8
1.6
Ltd
Linc Pen & Plastics
Neutral
257
-
379
382
420
9.3
9.5
13.5
15.7
19.1
16.3
3.3
2.8
17.1
17.3
1.1
0.9
M M Forgings
Neutral
485
-
585
546
608
20.4
20.7
41.3
48.7
11.7
9.9
66.4
58.7
16.6
17.0
0.9
0.8
Manpasand Bever.
Neutral
711
-
4,070
836
1,087
19.6
19.4
16.9
23.8
42.1
29.9
5.1
4.4
12.0
14.8
4.6
3.5
Mirza International
Buy
88
107
1,063
963
1,069
17.2
18.0
6.1
7.5
14.4
11.8
2.2
1.9
15.0
15.7
1.3
1.2
MT Educare
Neutral
88
-
349
366
417
17.7
18.2
9.4
10.8
9.4
8.1
2.1
1.8
22.2
22.3
0.9
0.7
Narayana Hrudaya
Neutral
315
-
6,442
1,873
2,166
11.5
11.7
2.6
4.0
119.2
79.5
7.3
6.6
6.1
8.3
3.5
3.0
Navkar Corporation
Buy
160
265
2,283
369
561
42.9
42.3
6.9
11.5
23.2
13.9
1.6
1.5
7.4
10.5
7.2
4.7
Navneet Education
Neutral
145
-
3,390
1,062
1,147
24.0
24.0
6.1
6.6
23.8
21.9
4.9
4.3
20.6
19.8
3.3
3.0
Nilkamal
Neutral
1,917
-
2,860
1,995
2,165
10.7
10.4
69.8
80.6
27.5
23.8
109.5
95.1
16.6
16.5
1.4
1.3
Page Industries
Neutral
14,392
-
16,052
2,450
3,124
20.1
17.6
299.0
310.0
48.1
46.4
320.5
244.7
47.1
87.5
6.6
5.2
Parag Milk Foods
Neutral
217
-
1,825
1,919
2,231
9.3
9.6
9.5
12.9
23.0
16.8
3.6
2.9
15.5
17.5
1.1
0.9
Quick Heal
Neutral
239
-
1,676
408
495
27.3
27.0
7.7
8.8
30.9
27.2
2.9
2.9
9.3
10.6
3.3
2.7
Radico Khaitan
Buy
126
147
1,680
1,667
1,824
13.0
13.2
6.7
8.2
19.0
15.4
1.7
1.6
9.0
10.2
1.4
1.2
Relaxo Footwears
Neutral
465
-
5,581
2,085
2,469
9.2
8.2
7.6
8.0
61.5
58.5
23.8
20.3
17.9
18.8
2.8
2.4
S H Kelkar & Co.
Neutral
292
-
4,219
1,036
1,160
15.1
15.0
6.1
7.2
47.8
40.7
5.1
4.7
10.7
11.5
3.9
3.5
Siyaram Silk Mills
Accumulate
1,664
1,872
1,560
1,652
1,857
11.6
11.7
92.4
110.1
18.0
15.1
2.7
2.3
14.7
15.2
1.2
1.0
Styrolution ABS India*
Neutral
606
-
1,066
1,440
1,537
9.2
9.0
40.6
42.6
14.9
14.2
38.1
34.7
12.3
11.6
0.7
0.6
Surya Roshni
Neutral
184
-
807
3,342
3,625
7.8
7.5
17.3
19.8
10.7
9.3
20.2
16.2
10.5
10.8
0.5
0.5
Team Lease Serv.
Neutral
902
-
1,543
3,229
4,001
1.5
1.8
22.8
32.8
39.6
27.5
4.2
3.7
10.7
13.4
0.4
0.3
The Byke Hospitality
Neutral
170
-
681
287
384
20.5
20.5
7.6
10.7
22.4
15.9
4.7
3.8
20.7
23.5
2.4
1.8
Transport Corporation of
Neutral
208
-
1,591
2,671
2,911
8.5
8.8
13.9
15.7
15.0
13.3
2.1
1.8
13.7
13.8
0.7
0.6
India
TVS Srichakra
Neutral
2,946
-
2,255
2,304
2,614
13.7
13.8
231.1
266.6
12.7
11.1
331.0
260.6
33.9
29.3
1.0
0.8
Stock Watch
March 10, 2017
Company Name
Reco
CMP
Target Mkt Cap
Sales ( Čcr )
OPM(%)
EPS (Č)
PER(x)
P/BV(x)
RoE(%)
EV/Sales(x)
(Č)
Price ( Č)
( Č cr )
FY17E FY18E FY17E FY18E FY17E FY18E FY17E FY18E FY17E FY18E FY17E FY18E FY17E FY18E
zOthers
UFO Moviez
Neutral
397
-
1,097
619
685
33.2
33.4
30.0
34.9
13.3
11.4
1.8
1.6
13.8
13.9
1.5
1.2
Visaka Industries
Neutral
236
-
375
1,051
1,138
10.3
10.4
21.0
23.1
11.2
10.2
30.2
28.3
9.0
9.2
0.6
0.6
VRL Logistics
Neutral
294
-
2,678
1,902
2,119
16.7
16.6
14.6
16.8
20.2
17.4
4.4
3.9
21.9
22.2
1.5
1.3
Wonderla Holidays
Neutral
378
-
2,136
287
355
38.0
40.0
11.3
14.2
33.5
26.6
4.8
4.2
21.4
23.9
7.1
5.8
Source: Company, Angel Research; Note: *December year end; #September year end; &October year end; Price as on March 09, 2017
Market Outlook
March 10, 2017
Research Team Tel: 022 - 39357800
DISCLAIMER
Angel Broking Private Limited (hereinafter referred to as “Angel”) is a registered Member of National Stock Exchange of India
Limited,Bombay Stock Exchange Limited and Metropolitan Stock Exchange Limited. It is also registered as a Depository Participant with
CDSL and Portfolio Manager with SEBI. It also has registration with AMFI as a Mutual Fund Distributor. Angel Broking Private Limited is a
registered entity with SEBI for Research Analyst in terms of SEBI (Research Analyst) Regulations, 2014 vide registration number
INH000000164. Angel or its associates has not been debarred/ suspended by SEBI or any other regulatory authority for accessing
/dealing in securities Market. Angel or its associates/analyst has not received any compensation / managed or
co-managed public offering of securities of the company covered by Analyst during the past twelve months.
This document is solely for the personal information of the recipient, and must not be singularly used as the basis of any investment
decision. Nothing in this document should be construed as investment or financial advice. Each recipient of this document should make
such investigations as they deem necessary to arrive at an independent evaluation of an investment in the securities of the companies
referred to in this document (including the merits and risks involved), and should consult their own advisors to determine the merits and
risks of such an investment.
Reports based on technical and derivative analysis center on studying charts of a stock's price movement, outstanding positions and
trading volume, as opposed to focusing on a company's fundamentals and, as such, may not match with a report on a company's
fundamentals. Investors are advised to refer the Fundamental and Technical Research Reports available on our website to evaluate the
contrary view, if any.
The information in this document has been printed on the basis of publicly available information, internal data and other reliable
sources believed to be true, but we do not represent that it is accurate or complete and it should not be relied on as such, as this
document is for general guidance only. Angel Broking Pvt. Limited or any of its affiliates/ group companies shall not be in any way
responsible for any loss or damage that may arise to any person from any inadvertent error in the information contained in this report.
Angel Broking Pvt. Limited has not independently verified all the information contained within this document. Accordingly, we cannot
testify, nor make any representation or warranty, express or implied, to the accuracy, contents or data contained within this document.
While Angel Broking Pvt. Limited endeavors to update on a reasonable basis the information discussed in this material, there may be
regulatory, compliance, or other reasons that prevent us from doing so.
This document is being supplied to you solely for your information, and its contents, information or data may not be reproduced,
redistributed or passed on, directly or indirectly.
Neither Angel Broking Pvt. Limited, nor its directors, employees or affiliates shall be liable for any loss or damage that may arise from
or in connection with the use of this information.